
Best U.S. Cities for IT Professionals 2021
By comparing data on salaries, job opportunities, business
environment, and livability, study reveals a ranking of cities
in the U.S. based on their attractiveness for IT
professionals.
As a technology-focused company, at Kisi we've seen how the ubiquity of digitalization has led to a higher demand for IT professionals than ever before. Being one of the most dynamic industries with ample job opportunities in the U.S., IT professionals often have a competitive advantage in choosing where to work and live. To delve into this topic further, we conducted a study determining which U.S. cities offer the most attractive conditions for IT specialists.
Since IT is a rapidly growing industry with an expanding scope of career prospects, we decided to first define which roles come under the “IT Professional” umbrella for the purpose of our research. We utilized the list of occupations provided by the U.S. Bureau of Labor Statistics, which includes - but is not limited to - computer and information research scientists, network architects, programmers, systems analysts, security analysts, web developers, and software developers.
A shortlist of both in-demand and up-and-coming U.S. cities in the technology industry were first selected. We evaluated career opportunities, including both the number of vacancies and firms operating in the IT industry, as well as the average salary among various positions along the career ladder, from entry-level to upper management. Next, we focused on a set of factors related to their respective work and living environments, along with those which affect a city’s livability. This included employment growth rate, benchmarks for affordability, and a startup ecosystem score.
The result is an index of seven factors determining the best U.S. cities for IT professionals, recognizing not only those cities known for being innovation hubs, but also those who are balancing opportunities with livability.
Each column is sortable, and the full methodology explaining how each factor was measured is located at the bottom of the page. All factors which have been labeled “Score” are out of 100. The higher the score, the better, with the exception of the Cost of Living Score, where the lower the score, the lower the cost of living.
Top Cities by Salary for IT Managers
1: San Francisco
$134,7812: Sacramento
$120,8483: New York City
$118,3834: Los Angeles
$118,0525: Seattle
$117,901
Top Cities for IT Professionals Overall
1: Austin
2: Seattle
3: San Francisco
4: Washington, DC
5: Dallas
IT environment
Business environment and livability
#
City
IT environment
Business environment and livability
Average IT Manager Salary (USD)
Average IT Director Salary (USD)
IT job openings over total openings
Number of top 500 MSPs
Yearly employment growth
Cost of living including rent (score)
Purchasing power (score)
Startup ecosystem (score)
Work-life balance (score)
Total score
Companies Hiring the Most IT Professionals in the U.S.
- #1
- #2
- #3
- #4
- #5
- #6
- #7
- #8
- #9
- #10
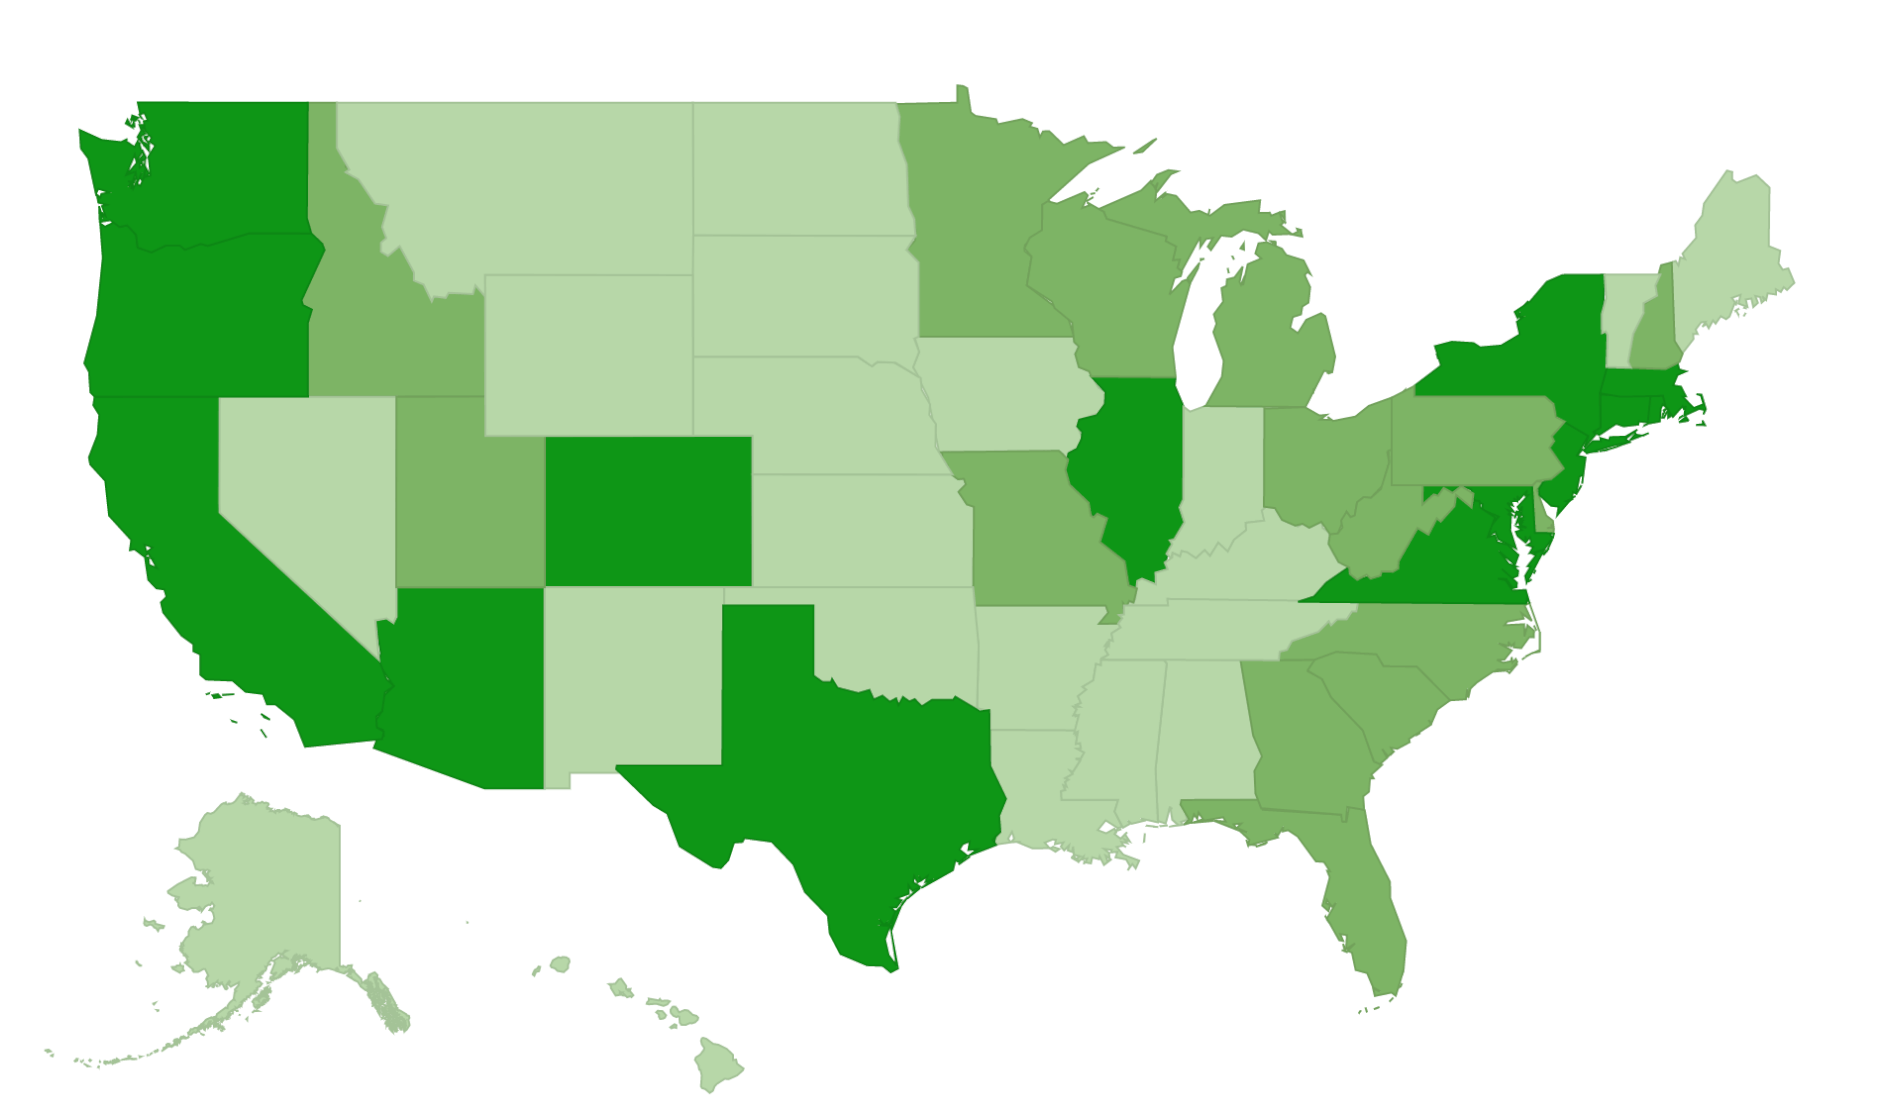
IT Salaries by State
Methodology
Based on raw data, each factor was given a score out of 100, with the highest-ranked city scoring 100 and each city below that receiving a score proportionate to 100.
The scores for the “IT Environment” category, which included “Average IT Manager Salary”, “Average IT Director Salary” and “IT job openings over total openings”, were averaged. The same was then done for the “Business Environment and Livability” category, which included “Employment growth YoY”, “Cost of living including rent (score)”, “Purchasing power (score)” and “Startup ecosystem (score)”. An average was then taken of these two averages, to calculate the “Total score”.
The scores for the “Number of top 500 MSPs” and “Work-life balance (score)” were not taken into account for this ranking, however, the figures are still included in the tables as supplementary data.
Sources for each factor can be found below:
Average IT Manager and IT Director Salary
Salary data from Glassdoor.com based on over 15,000 salaries as of 11/19/2019.
IT Job Openings Over Total Openings
Job opening data based on Indeed.com for over 1.3M jobs listed as of 11/20/2019.
Yearly Employment Growth
Based on data from the U.S. Bureau of Economic Analysis for the years 2017 and 2018
Number of Top 500 MSPs
Data based on CRN list of the 500 largest managed service providers in North America. This factor is reported in order to indicate the IT business environment in each city, but it is not factored in the total score.
Cost of Living Including Rent (score)
Based on Numbeo data
Purchasing Power (score)
Based on Numbeo data
Startup Ecosystem (score)
Score based on StartupBlink’s report
Work-life Balance (score)
Work-life balance score based on Kisi’s 2019 study
Companies Hiring the Most IT Professionals in the U.S.
Based on data from indeed.com.
IT Salaries by State
Based on data from Global Knowledge
About Kisi:
Founded in 2012 in Brooklyn, NY, Kisi is a cloud-based keyless access control system providing mobile-first security solutions. Businesses of every size and industry use Kisi's hardware and software to secure their spaces, streamline operations and build a vibrant office culture.
For press inquiries please reach out to press@getkisi.com