
The Kisi Analytics feature helps you see the current status of your spaces at a glance, enabling quicker decision-making and more robust reporting.
Real-time, accurate analytics are crucial to understanding how often your facility is being used, the current occupancy, and who is using each place. Consider these situations:
- As an IT admin, you might want to leverage occupancy data to plan hardware needs for your co-workers before they show up
- As an operations or office manager, you might want to get notified if there is an unsafe amount of people in a space
- As a team manager, you can easily see when certain staff members arrived at the office, or check how many of your hybrid employees are on-premise
With Analytics in Kisi you get real-time and historical data about facility usage, including the current occupancy rate of a place, the latest unlocks of the day by user, a weekly heatmap, and more.
You can even install in-and-out readers on your main doors to get precise entry/exit data and metrics.
To start using Analytics, log into your Kisi Organization, navigate to a Place, and select the Analytics tab on your dashboard.
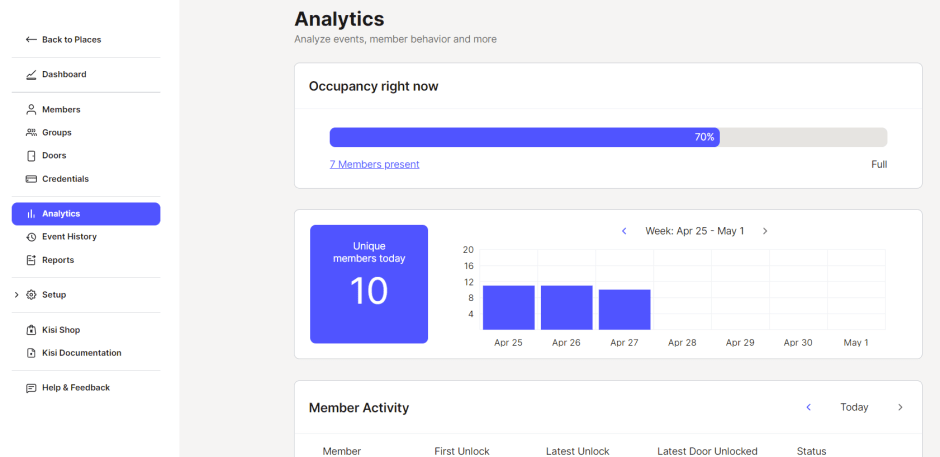
Ensure effective space usage by monitoring the occupancy rate of a place
The first chart on the top of your analytics view shows the current occupancy of your place.

By clicking on Configure you will land on the Capacity Management page where you can:
- Decide how you want Kisi to calculate occupancy (through presence estimation or via in-an-out readers)
- Set your max capacity
- Define who should be notified when capacity has reached 75%, 100% and 150%.
Configuring Capacity Management also lets your users see the occupancy levels of your space in the Kisi app.
Keeping an eye on the occupancy rate of your places helps to ensure effective space usage, or boost customer service experience by always setting the appropriate staff level.
View the number of people active at your places on a given day
The next chart gives you the number of unique users on the current day, as well as a summary of unique users distributed on days of the current week. The bar chart is clickable, showing you a list of unlocks by users on a selected day.

With this chart, you can easily identify the busiest days at your spaces. This, in turn, can help you plan staffing, meetings, and events in your places.
See the latest user unlocks of the day and get quick access to the user's profile
The User activity list gives you an overview of all the unlock events that happened on the current day by user, their first and latest unlock, which door they unlocked last, and if they are on-site or inactive.
Presence data is by default estimated based on the configured inactivity time. For more precise data we recommend installing in-and-out readers.

By clicking on the User’s name you can access their profile. On the user profile, you can click on Events and view a log of access events that they initiated, including related video snapshots if you have an active video surveillance integration.

Identify the busiest hours of the day with the activity heatmap
The place activity heatmap shows you the number of unlock events by hour, for every day of the week.

This chart helps to identify the busiest hours of the day and plan facility operations accordingly. You can click on an individual tile to see all the unlock events in that time slot.
Wrapping it up
Having accurate information about facility usage can make or break your facility operations plan. With Kisi's Analytics feature you get real-time and historical data about the status of your spaces at a glance, so you can make informed decisions faster and run more robust reporting.
Leave us feedback!
Kisi Feature Spotlight is a recurring series to highlight some of the greatest functionalities in Kisi. Shoot an email to let us know which feature you’d like to read more about in our next blog.
Not a Kisi customer yet?
Don’t hesitate to ask for a quote!

Katalin Haverinen-Varga
Product documentation writer with a passion to translate technical features into customer value.