Most space operators and facility managers know intuitively that their space isn't being used as well as it could be. The harder part is proving it and knowing what to do about it. Space utilization can solve that problem since it gives you the data to make decisions that reflect how your space is being used.
In this guide, we'll break down what space utilization means, how to calculate it, and how to track it accurately, no matter what space you are managing, whether that's a corporate office, a coworking space, or a fitness facility.
What is space utilization? #
Space utilization measures how effectively a physical space is being used over time. It compares how much of your available space really is in use against total capacity, and it looks at usage patterns across hours, days, and weeks.
It's different from occupancy, which is a point-in-time headcount. Occupancy tells you how many people are in a space right now. Utilization tells you how well that space is performing over time. A conference room might be at full capacity every time someone's in it, but if it's only used twice a week, its utilization rate is low.
The importance of space utilization #
Real estate is typically the second-largest operational cost for any organization, after payroll. When a significant portion of that space goes unused on a regular basis, then you're paying for square footage that isn't bringing you value. Industry research, for example, puts the average at 54% for global office utilization, meaning nearly half the space organizations are paying for sits unused on any given workday.
On top of that, hybrid work schedules have made this harder to manage. With flexible arrangements you can no longer rely on predictable attendance patterns and coworking spaces sell memberships without always knowing which rooms get used. On the other side of the spectrum, fitness studios see full classes on weekends and near-empty rooms on weekday afternoons.
All of these naturally compound, so having knowledge on space utilization helps you match your space supply to demand to make a data-backed case when it's time to expand or even update your current space.
Space utilization metrics and how to calculate them #
The core formula for measuring space utilization is pretty simple:
Utilization rate = (used space ÷ total available space) × 100
The "used space" depends on what you're measuring and here are a few examples of that:
- A conference room is available for 40 hours per week and is booked and occupied for 22 of those hours, so the utilization rate would be 55%.
- You have 80 desks in your office and on an average day, 48 are in use, so here the utilization rate is60%.
- A group fitness room holds 20 people and average attendance per class is 14, so you have an utilization rate of 70%.
Beyond the base rate, a few other metrics are worth tracking such as peak utilization, which identifies when demand is highest. This is particularly useful for scheduling, staffing decisions, and spotting when a space is under pressure.
Another thing would be the frequency of use tracks how often a room or zone is accessed over a given period, independent of capacity. High frequency in a small room is a good sign, but low frequency in a large one is worth investigating.
Finally, there is the “utilization by zone” metric which breaks your space into categories (e.g. private offices, shared desks, meeting rooms, common areas) so you can compare performance across space types and prioritize changes the best you can.
How to measure space utilization #
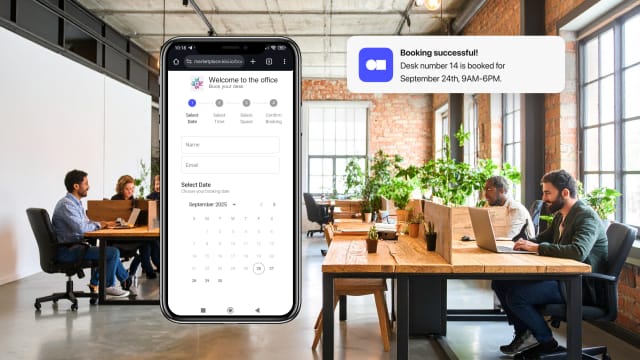
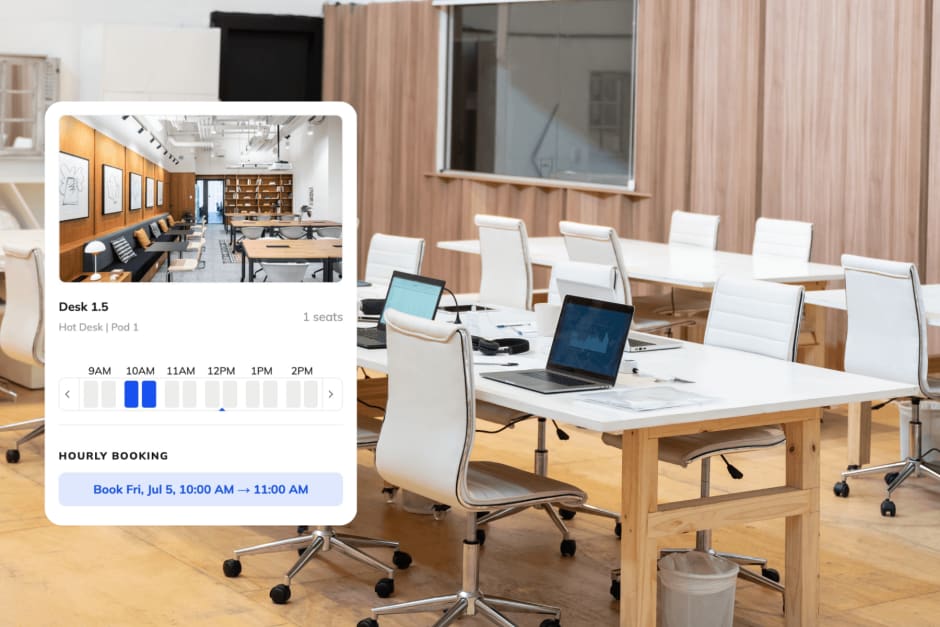
Booking data is the most common starting point because if people reserve desks or rooms, you get a log you can analyze. The limitation is that reservations don't equal actual use because of no-shows, which means calendar data tends to overstate how well your space is performing.
Occupancy sensors are more accurate but add hardware cost and complexity, and they typically tell you that someone is in a room, without any context about who or why.
Access control data offers a different, better angle. When people badge in and out of rooms, the system generates timestamped records tied to real users. You get actual entry and exit data rather than reservation intent.
For example, Kisi's in-and-out tracking works by placing readers on both sides of a door, capturing both when someone enters and when they leave. That data feeds into Kisi's analytics dashboard automatically, so the door activity itself becomes your dataset.

Space utilization by space type #
Collecting utilization data is only useful if it changes how you operate. A few practical applications across space types:
- For corporate offices: If utilization data shows your desks are consistently at 40% on Mondays and Fridays but over capacity on Tuesdays and Wednesdays, that's a scheduling problem. Staggered hybrid policies, or incentives to spread attendance across the week, can smooth demand without adding a single square foot. If specific floors or zones are chronically underused, you have a consolidation opportunity worth quantifying before your next lease renewal.
- For coworking and flex spaces: Low utilization on large meeting rooms is usually a signal that the room size doesn't match how members book. If you split a 10-person room into two smaller ones, or convert a rarely used boardroom into additional phone booths, you can increase both utilization and revenue from the same footprint. Utilization data also tells you which membership tiers are using which spaces, so that’s very useful when you're deciding whether to add or cut a room type.
- For fitness and sports facilities: If a specific class time or court slot consistently underperforms, that's a scheduling adjustment, not necessarily a demand problem. Utilization data by room and time slot helps you move programming to where demand is, instead of where you assumed it would be when you built the schedule.
How to improve space utilization #
Collecting utilization data is only useful if it changes how you operate. For example, if a room type is consistently underused, consider converting it, or if a large conference room that mostly hosts two or three people is a candidate for reconfiguration into smaller, more frequently bookable spaces.
In a similar vein, If peak hours are creating bottlenecks, use utilization data to spread demand, meaning staggered class times in a fitness setting or adjusted booking windows in coworking. If your overall utilization rate sits below 40%, it's worth examining whether your space mix reflects how people want to use your facility, rather than how it was originally designed.
The bottom line here is that if you're planning to expand or open a new location, utilization data is the most credible evidence you can bring to that decision. Membership numbers definitely tell part of the story, but it’s how your existing space is performing that actually tells the rest.

What good space utilization data looks like #
Speaking of data, good utilization data answers a few specific questions:
- which spaces are consistently underperforming
- which are under pressure
- when demand peaks across the week.
The most actionable outputs for facility managers are usually a consistent view of rooms below 30% utilization (candidates for repurposing), spaces that regularly hit capacity (candidates for schedule adjustments or expansion), and day-of-week patterns that inform staffing and programming decisions.
How you access that data however, depends on your setup. To give you an example, spaces that run access control through Kisi, it's organized automatically inside the Insights dashboard. The space activity hub provides six views into a selected space over a chosen time period: peak usage hours, daily trends, adoption over time, top doors by activity, failed access attempts, and hardware status.
In this particular instance, weekly place analytics summarize usage at a higher level (a.k.a. overall activity by day, unique users, credential types) without requiring a custom report pull each time. From there, reports can be scheduled for automatic delivery or generated on demand for any date range.
Track space utilization with Kisi #
Unfortunately, today there are a lot of operators who add utilization tracking as an afterthought or not at all. If they do, they treat it like a separate tool, an extra sensor layer, another dashboard to check. What that does is make the data end up siloed and the insights come too late to be useful.
Kisi approaches it differently, because the hardware that manages door access generates detailed access event data automatically, which means you're building a picture of how your space is used from day one of installation and all that without additional sensors or a separate analytics platform. The door activity is the dataset.
For operators who want to stop making space decisions based on gut feel, that's a meaningful difference. In the end, better space decisions start with better data and if that sounds right to you, contact our team to get a quote tailored to your space.


Ana Coteneanu
Content writer @ Kisi | Ana focuses on long-form content that explores access control, space monetization, security, and modern workplace operations. With a background in technology-driven industries, she specializes in turning complex topics into practical insights for business audiences.